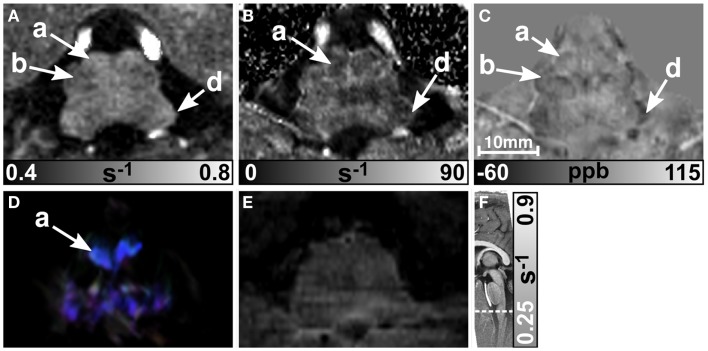
Figure 6.
Images of the middle part of the medulla oblongata. R1, , and susceptibility maps as well as track-density (same color-encoding as in Figure 1; slightly distorted compared to the other axial image contrasts) and T2-weighted images of the same region are presented in axial orientation from (A–E), respectively. The sectional plane of the axial images is indicated by the dashed line overlaid on the sagittal R1 map shown in (F). The arrows in the images indicate: (a) pyramid, (b) inferior olive, and (d) inferior cerebellar peduncle.

