Figure 2.

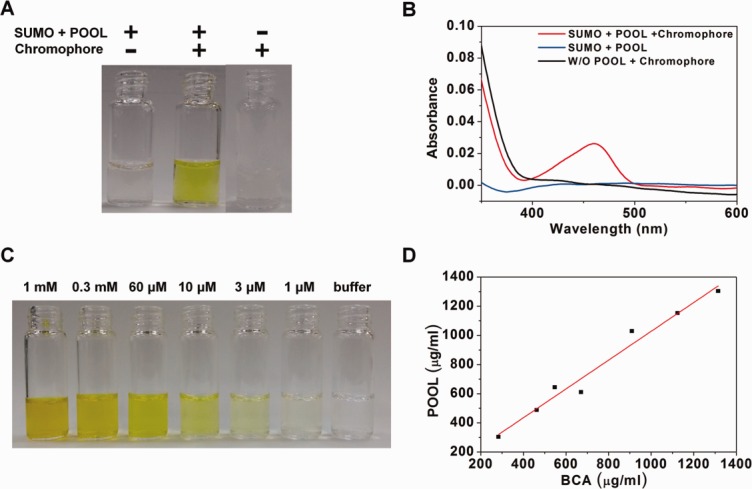
Quantification of the target protein with/without the POOL system by observing the color change and UV–Visible spectroscopy. This figure shows a comparison of the color difference and UV–Visible spectra before and after adding a precursor of chromophore. (A) The color change with/without POOL. The first corresponds to SUMO–POOL fusion protein before adding a precursor of chromophore. The second corresponds to SUMO–POOL fusion protein after adding a precursor of chromophore. The third corresponds to a target protein not fused with POOL after the addition of a precursor of chromophore. (B) UV–Visible spectra corresponding to (A). The blue, red and black curves correspond to the first, second and third cases of (A), respectively. (C) Standard reference solutions used for estimating the concentration. (D) Comparison of the protein concentration measured by the BCA method and POOL method. The slope is 0.99 with a mean error of ∼4%.
