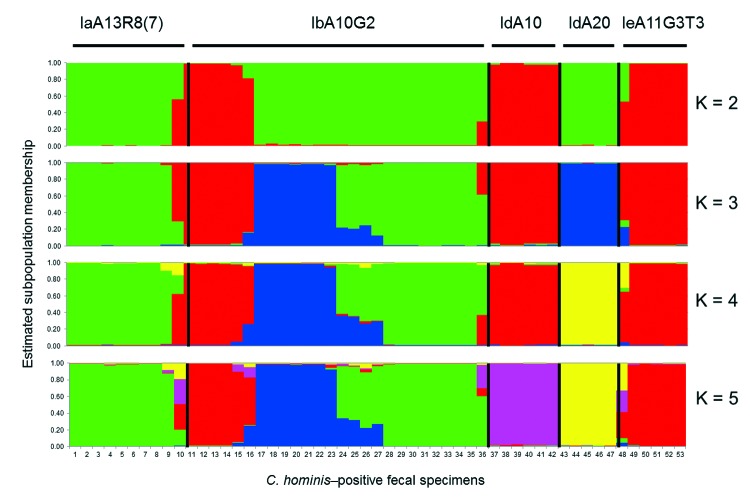
Figure 1.
Relationship among various 60-kDa glycoprotein gene subtypes of Cryptosporidium hominis by substructure analysis. Predicted population numbers K = 2–5 were applied in STRUCTURE version 2.2 (http://pritch.bsd.uchicago.edu/structure.html) analysis of the data. Colored regions indicate major ancestral contributions. Mixed genotypes are indicated by the pattern of color combinations. Values along the baseline indicate C. hominis–positive fecal specimens.

