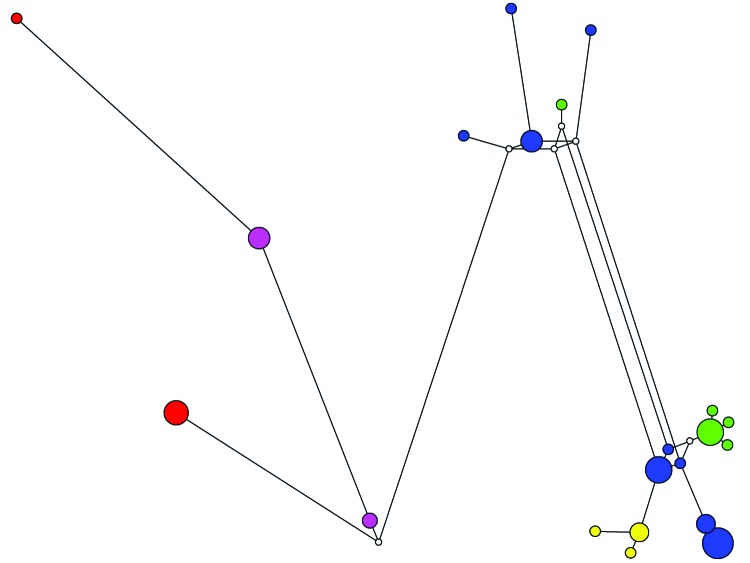
Figure 2.
Median-joining network for various subtypes of Cryptosporidium hominis. Circles are proportional to the frequency of each multilocus genotype (MLG) (21 MLGs on the basis of segregating sites of concatenated sequences excluding the 60-kDa glycoprotein gene). The color of each circle represents the 60-kDa glycoprotein gene subtypes of the C. hominis specimens: IaA13R8 (green), IbA10G2 (blue), IdA10 (purple), IdA20 (yellow), and IeA11G3T3 (red). Length of lines connecting MLGs is proportional to the number of single-nucleotide polymorphisms.

