FIGURE 1.
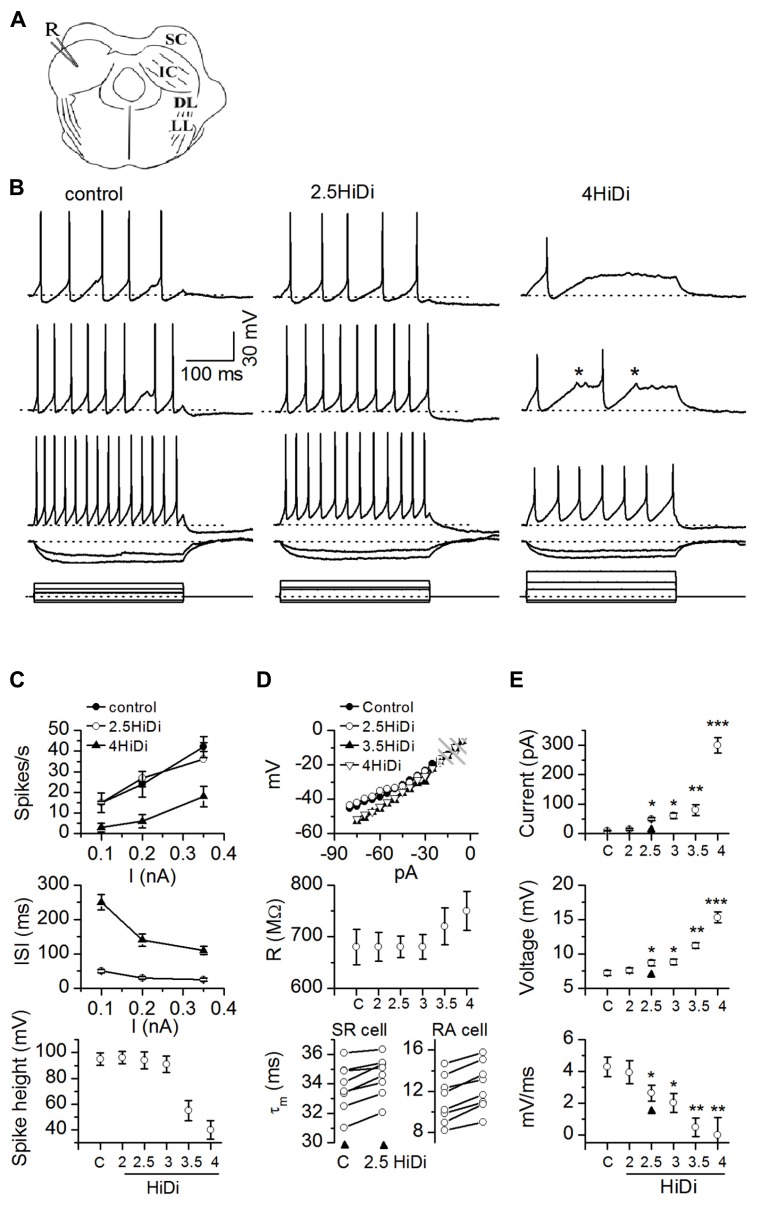
HiDi concentration effects on intrinsic membrane properties. (A) Transverse IC slice with patch electrode (R) for current injection and voltage recording. SC: superior colliculus; DL: dorsal nucleus of the lateral lemniscus; LL: lemniscal tract. Slices were bathed in different HiDi concentrations. (B) Intrinsic firing evoked by current steps. Sustained-regular cell (postnatal day 26). Left, middle: firing patterns remained sustained in 2.5 HiDi. Right: at higher divalent strengths (≥3.5 HiDi), spikes shortened and aborted (asterisks). When spiking did occur, firing remained sustained. Current steps are at the bottom of each column. Voltage responses are illustrated to three depolarizing and two hyperpolarizing current steps. Depolarizations increase from top to bottom; responses to the two hyperpolarizing currents are superimposed. Hyperpolarizing current steps were kept the same in ACSF and HiDi; depolarizing currents were increased in HiDi to evoke either roughly the same number of spikes as in the control (2.5 HiDi) or to cross firing threshold (4 HiDi). Currents were <0.5 nA to prevent membrane rupture, therefore spike frequencies in 4× HiDi did not reach control rates. (C–E) Summary of intrinsic membrane properties in control ACSF (C) and different HiDi concentrations. (C) Sustained-regular cells (P15–23). (D) Top, middle: sustained regular cells; Bottom: sustained-regular and rebound-adapting cells. (E) Data pooled from different intrinsic cell types. Cell type nomenclature from Sivaramakrishnan and Oliver (2001). (C) Spike characteristics. At ≤ HiDi, spike frequencies, inter-spike intervals, and spike heights were normal, ≥3 HiDi lowered spike frequencies, increased inter-spike intervals and decreased spike heights, 16 cells. Mean and SEM ANOVA for ACSF/2, 2.5, 3, 3.5, 4 HiDi. Spike frequencies: F6,90 = 2.82; p = 0.01; Inter-spike intervals: F6,90 = 2.87; p = 0.01. Spike heights: F6,90 = 3.01; p = 0.01. (D) Passive membrane properties in HiDi. Top: input resistance (R) plotted for one sustained-regular cell. Same cell as in (B). Membrane potentials (ordinate) are relative to the resting membrane potential. Shaded area: the range of membrane potentials resistant to HiDi. Middle: average input resistances, 18 neurons. Mean and SD. Paired t-tests: ACSF, 2, 2.5, 3 HiDi, p > 0.33 in each condition. Input resistances deviated at larger hyperpolarizing currents; p < 0.004. Bottom: membrane time constants in control ACSF (C) and 2.5 HiDi shown for individual sustained regular cells (SR; left) and rebound-adapting (RA) cells (right). Eight cells in each panel. (E) Effects of HiDi on threshold. Top: injected current at which spike threshold was reached; Middle: membrane potential at threshold; Bottom: rate of rise of membrane voltage to threshold. Mean and SD 24 cells. Seven sustained-regular, 12 rebound, 5 pause-build. *p < 0.01; **p < 0.001; ***p < 10-5.

