FIGURE 3.
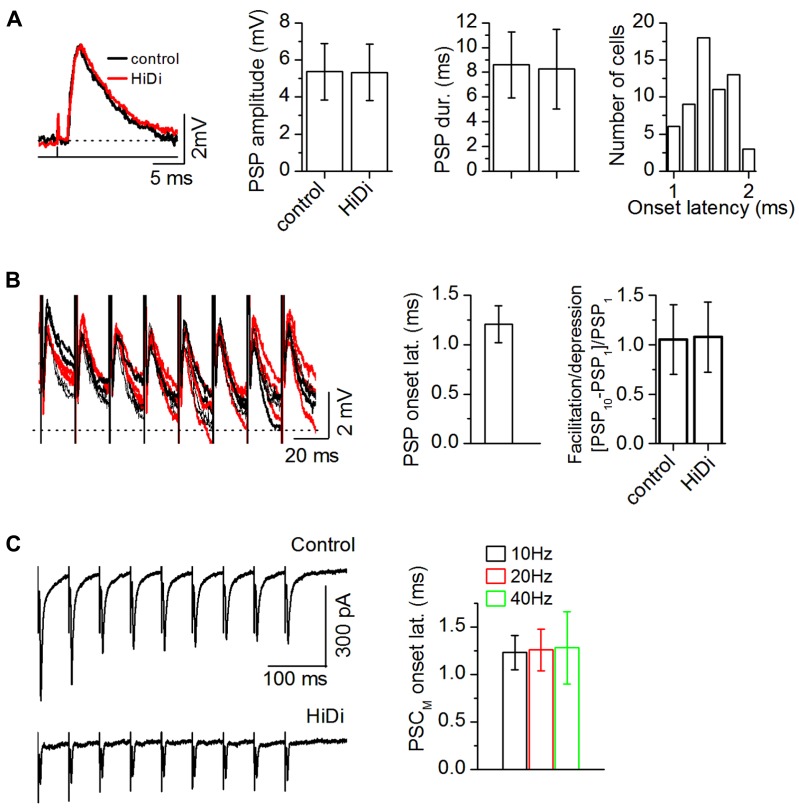
Criteria for establishing a HiDi-insensitive response in slices as monosynaptic. (A) HiDi does not affect postsynaptic potentials (PSPs) evoked by minimal (>50% failure rate) LL stimulation. Left: PSPs from one cell. Shock strength: 0.1 ms, 0.2 mA. Middle: PSP durations and peak amplitudes, 42 cells. Mean and SD. PSP duration: t83 = 0.71; p = 0.48; PSP amplitude: t83 = 0.48; p = 0.63. Right: the lack of variability in onset latency between trials confirmed a monosynaptic source. Distribution of onset latencies measured from the stimulus artifact, 60 neurons. Onset latencies were within a ~1 ms range (1.01–1.97 ms; mean 1.48 ms; SD 0.28). Because the SD of this distribution was <1 (0.28 ms), responses were considered monosynaptic if their onset latencies during repeated trials did not vary by >1 ms. (B) HiDi has no significant effect on PSPs evoked by a stimulus train at minimal shock strengths. Left: superimposed responses to repeated trials in one cell. Shock strength: 0.15 ms, 0.4 mA. PSPs remained insensitive to HiDi throughout the train (20–50 Hz trains; PSP amplitudes: F9,290 = 1.39; p = 0.19), 33 cells. Middle: PSP onset latencies during successive stimuli varied by less than one SD (1.21 ± 0.19 ms; 21 cells) verifying a monosynaptic input. Average of the first 5 pulses in 20 Hz trains of 10 pulses/train, 21 cells. Mean and SD. Right: ratio of the change in PSP peak amplitude between the first and last stimulus pulses, 20 Hz train, 10 pulses, 33 cells; Mean and SEM (t65 = 1.16; p = 0.25). (C) Left: recordings of synaptic currents evoked by a 20 Hz LL stimulus train with non-minimal (<10% failure rate) shock strengths (50% above threshold). Stimulus strength was adjusted to evoke a depressing response during the train. Holding potential -66 mV. Right: onset time of the HiDi-insensitive component (PSCM) during stimulus trains. Data are plotted for 10, 20, 40 Hz trains. Fifty-one cells were tested. Forty-two cells met the 1 ms SD criterion for onset variability. Mean and SD: 1.26 ± 0.22 ms. Data plotted from 25 of the 42 cells. (A–C) 2.5 HiDi.

