. 2013 Oct 29;2:e01298. doi: 10.7554/eLife.01298

Figure 3. Polymorphism of five IRG genes.

(A) Phylogenetic trees of five IRG genes sequenced from DNA of wild mice collected from various sites in Eurasia. Green, blue and red taxa represent M. m. domesticus, M. m. musculus and M. m. castaneus samples respectively. The black taxon represents Mus spretus. Alleles found in heterozygous condition in certain mice are indicated by numbers appended to individual mouse identifiers (some haplotypes contain 2 Irgb6 paralogous genes (Figure 2B), hence potentially up to 4 alleles). Bootstrap values are shown if >90. The sequences are avaliable in (Figure 3—source data 2-6). (B) The nucleotide pairwise diversities (π) of genes across seven laboratory and wild-derived inbred mouse strains (BL/6, AKR/J, MSM/Ms, CAST/Ei, PWK/PhJ, WSB/Ei and Spretus/EiJ). Grey bars indicate the distribution of π from 50 ‘random’ genes (Figure 3—source data 1). The π values of individual IRG and MHC genes are indicated by arrows.

DOI: http://dx.doi.org/10.7554/eLife.01298.007

Figure 3—source data 1. Nucleotide diversities of 50 random genes in seven mouse strains.
Seven laboratory and wild-derived inbred mouse strains were analysed. The ORFs of 50 random genes were selected based on their position in the C57BL/6 genome (NCBI reference assembly build 37). In addition, selected IRG and MHC members were assembled, and Tajima's π values were calculated. Klra4 is closest to 130M in Chr 6, but lost in many mouse strains (Cutler and Kassner, 2008). The adjacent gene Klra5 was used instead.
elife01298s001.xls (31KB, xls)
DOI: 10.7554/eLife.01298.008
Figure 3—source data 2. Alignment of Irgm1 alleles, in FASTA format.
elife01298s002.fas (57.3KB, fas)
DOI: 10.7554/eLife.01298.009
Figure 3—source data 3. Alignment of Irga6 alleles, in FASTA format.
elife01298s003.fas (65.1KB, fas)
DOI: 10.7554/eLife.01298.010
Figure 3—source data 4. Alignment of Irgb2 alleles, in FASTA format.
elife01298s004.fas (46.9KB, fas)
DOI: 10.7554/eLife.01298.011
Figure 3—source data 5. Alignment of Irgb6 alleles, in FASTA format.
elife01298s005.fas (88.9KB, fas)
DOI: 10.7554/eLife.01298.012
Figure 3—source data 6. Alignment of Irgb10 alleles, in FASTA format.
elife01298s006.fas (53.4KB, fas)
DOI: 10.7554/eLife.01298.013

Figure 3.

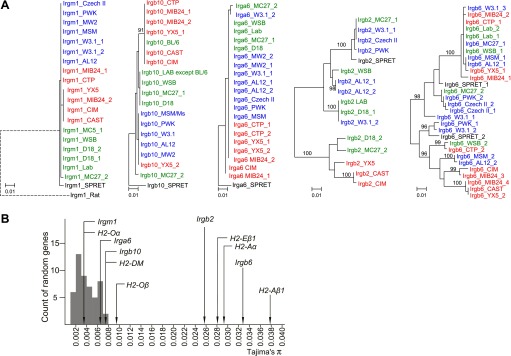
Figure 3—figure supplement 1. Mouse samples collected for this study.

Figure 3—figure supplement 1.

Colour code relates to the individual subspecies (green—M. m. domesticus, blue—M. m. musculus, red—M. m. castaneus) and corresponds to the text colours for the phylograms displayed in Figure 3 and Figure 3—figure supplement 2–4. Purple colour indicates the hybrid zone of M. m. musculus and M. m. castaneus. The definition of M. m. castaneus in the Indian subcontinent is complex. Modified from Din et al. (1996); Guenet and Bonhomme, 2003.

Figure 3—figure supplement 2. Phylogenetic trees of Irga6, Irgm1 and Irgb10 in mouse strains and wild mice.

Figure 3—figure supplement 2.

Figure 3—figure supplement 3. Phylogenetic tree of Irgb2 in mouse strains and wild mice.

Figure 3—figure supplement 3.

Figure 3—figure supplement 4. Phylogenetic tree Irgb6 in mouse strains and wild mice.

Figure 3—figure supplement 4.

HHS Vulnerability Disclosure