
Figure 1. Determination of  and
and  from the mass spectrometric records by minimizing the sum of squared deviations.
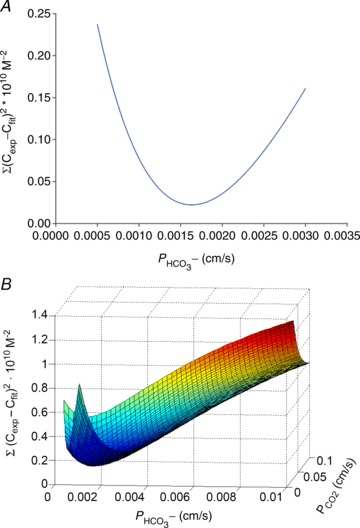
 Illustration of the fitting procedure used to determine
  at a given
  of 0.12 cm s−1 (A) or both
  and
and  (B). The sum of squares of deviations between experimental concentrations of C18O16O and their counterparts from the calculated C18O16O decay curve as obtained with the fitted values of
  /
/ are plotted vs. the value of
  (A) or vs. both the values of
  and
and  (B).
(B).