
Figure 4. FRET measurements of CyPet- and YPet-labelled fusion proteins in tsA201 cells.
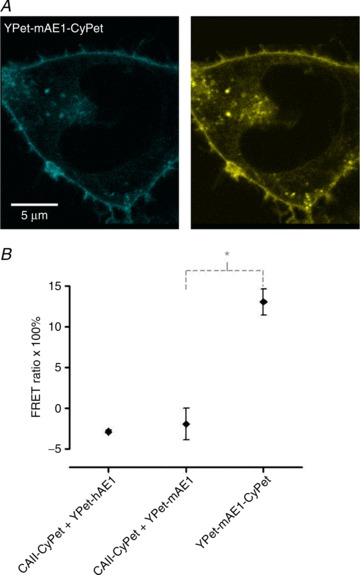
A, confocal microscopic images of a tsA201 cell transfected with the doubly labelled construct of mAE1 N-terminally fused with YPet and C-terminally fused to CyPet. Illumination with 458 nm excites both CyPet (left) and YPet (right), the two dyes yielding an identical pattern. This construct gives the positive FRET signal seen in Fig. 5B. B, results of FRET experiments with tsA cells cotransfected with CAII-CyPet and YPet-hAE1 (left), with CAII-CyPet and YPet-mAE1 (centre), and a FRET control in cells transfected with YPet-mAE1-CyPet (right). This latter construct ensures proximity of the two dyes, reflected in its significantly positive FRET signal. *P < 0.01 (t test); n from left to right is 3, 7 and 7. Bars represent SE values.