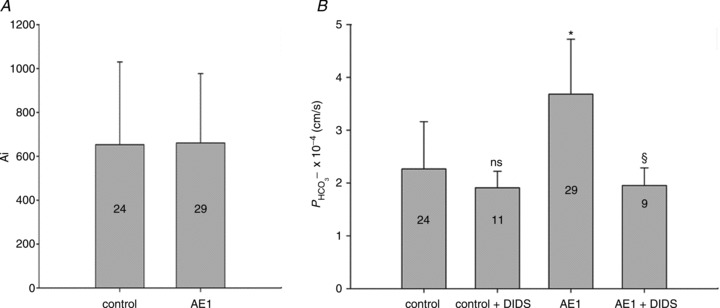
Figure 5. Carbonic anhydrase activity and HCO3− permeability in native and YPet-mAE1-expressing tsA201 cells.

A, intracellular CA activities measured in lysates of untreated tsA201 cells (control) and tsA201 cells transfected with YPet-mAE1 (AE1), using the mass spectrometric 18O technique. B, cellular  measured in untreated tsA201 cells (control) and in tsA201 cells expressing YPet-mAE1 (AE1), in the absence or presence of DIDS (10−5
m), a strong inhibitor of AE1 transport function. DIDS showed no effect on
  of control cells, but inhibited the AE1-associated increase in
  . ns, P > 0.05, *P < 0.02, §P < 0.02. Number of measurements are inside the columns. Error bars represent SD values.
