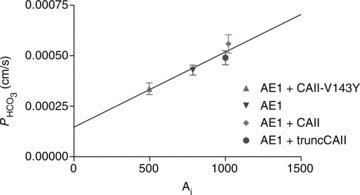
Figure 6. Bicarbonate permeability of tsA201 cells as a function of intracellular CA activity, Ai.

tsA201 cells transfected with YPet-mAE1 (‘control’) (▾); tsA201 cells co-transfected with CAII-V143Y-CyPet and YPet-mAE1 (▴); co-transfection with WT CAII-CyPet and YPet-AE1 (♦); co-transfection with N-terminally truncated CAII-CyPet and YPet-mAE1 (•). Observed variations of  are linearly related to intracellular CA activity. Correlation coefficient r= 0.90. Bars represent SE values. Number of determinations n= 17, 18, 17 and 33 (from left to right). All permeabilities under expression of the various CAII's are statistically significantly different from the mean control
  value (▾, transfection with YPet-mAE1 only). P values between <0.01 and <0.05.
