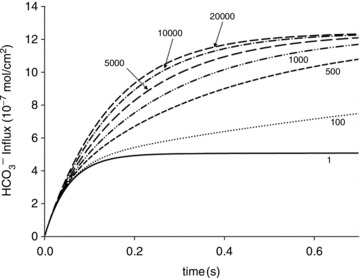
Figure 8. Time courses of bicarbonate influx, expressed as mol HCO3− (cm2 membrane surface area)−1, for various intra-erythrocytic CA activities, calculated with the model illustrated in Fig. S2 (upper scheme).

The numbers on the curves indicate the acceleration factors of CO2 hydration. Therefore, 1 indicates the absence of CA activity, and 20,000 an activity of (20,000 – 1). The dependence of HCO3− influx on CA activity is most pronounced between 1 and 1000, and becomes minor between 5000 and 20,000.
