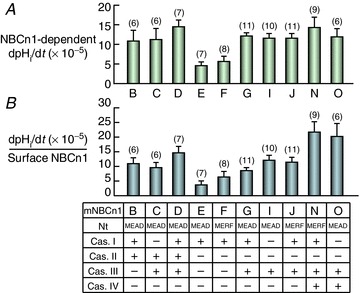
Figure 9. NBCn1-dependent functional expression (A) and intrinsic HCO3− transport activity (B).

In A, we subtract from the dpHi/dt values of individual NBCn1-expressing oocytes the mean dpHi/dt value of all H2O-injected control oocytes (studied contemporaneously with NBCn1-expression oocytes) to obtain the NBCn1-dependent dpHi/dt (a measure of functional expression). A one-way ANOVA (overall P value = 0.0013) followed by a post hoc Tukey's comparison shows that the differences between the following pairs are significant: D/E, D/F, E/G, E/N and F/N. In B, we normalize the NBCn1-dependent dpHi/dt values from individual oocytes (contributing to the bars in A) to the mean surface NBCn1 levels (Fig. 8C) using a likelihood-based approach. The standard errors were produced using a bootstrap procedure. These normalized dpHi/dt values are indices of the intrinsic HCO3− transport rate of NBCn1 (i.e. the per-molecule transport activity). A bootstrap test, followed by a very conservative Bonferroni correction, shows that the following pairs are significantly different: E/D, E/I, E/J, E/N, E/O, F/N, F/O and G/N. Numbers in parenthesis: N of oocytes.
