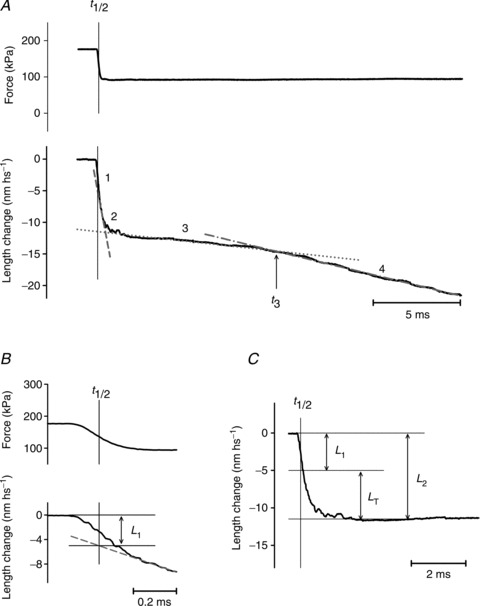
Figure 1. Isotonic velocity transient following a step in force to 0.5 T0 superimposed on the isometric contraction.

A, shortening of the half-sarcomere (lower trace) in response to the step to 0.5 T0 (upper trace). Numbers above the shortening record identify the phases of the transient; t3 marks the transition between phases 3 and 4. B and C, early components of the shortening showing the method for estimating L1 and L2. L1 is measured by extrapolating the tangent to the initial part of phase 2 response (dashed line in A and B) back to the half-time of the force step (t½, indicated by the vertical line). L2 is measured by extrapolating the ordinate intercept of the tangent to the phase 3 response (dotted line in A) back to t½, to suppress the small contribution of phase 3. Alternatively, as shown in C, the whole time course of phase 2 shortening leading to L2 is calculated by subtracting the phase 3 tangent from the record starting from t½. LT, the size of the working stroke, is obtained by subtracting the elastic response L1 from L2. Steady shortening velocity is estimated from the slope of the tangent to phase 4 response (dotted–dashed line in A). Fibre segment length, 3.3 mm; segment length under the striation follower, 1.0 mm; average sarcomere length, 2.51 μm; CSA, 3780 μm2; temperature, 11.8°C.
