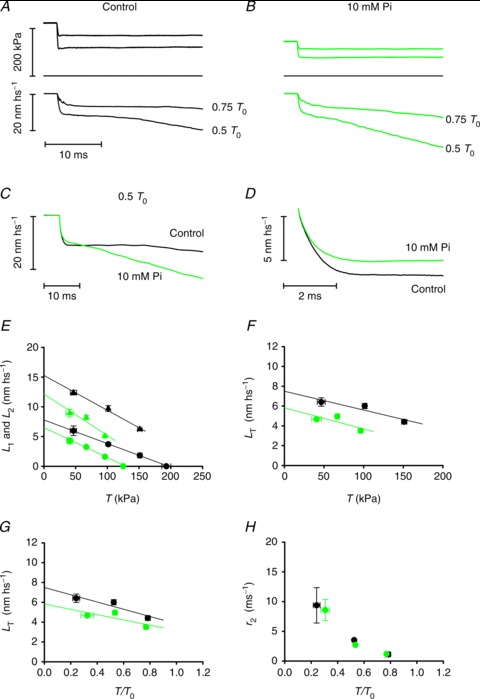
Figure 2. Early phases of the isotonic velocity transient at different loads and the effect of Pi.

A and B, isotonic velocity transients (lower traces) following force steps (upper traces) to 0.75 and to 0.5 T0 in the control (A) and in the presence of 10 mm Pi (B); middle traces, force baseline. C, superimposed isotonic velocity transients following a force step to 0.5 T0 in control (black trace from A) and in 10 mm Pi (green trace from B). D, superimposed phase 2 transients in control (black trace) and in 10 mm Pi (green trace), obtained after subtracting phases 1 and 3 shortening as in Fig. 1C. E, relation of L1 (circles) and L2 (triangles) versus force in control (black symbols) and in 10 mm Pi (green symbols). F, relation between the shortening accounted for by the working stroke (LT) and the force T (kPa) in control (black circles) and in 10 mm Pi (green circles). G, same relations as in F, with force expressed in relative units T/T0. H, dependence of the rate constant of the working stroke (r2) on force in control (black circles) and in 10 mm Pi (green circles). In panels E–H, data are the means ± SEM from the five fibres used in these experiments.
