
Figure 3. Late phases of the isotonic velocity transient at different loads.
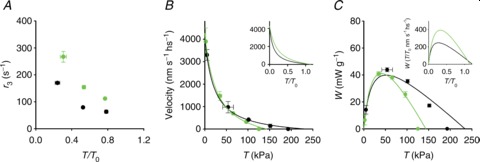
A, dependence of the rate of phase 3 (r3) on T/T0 in control (black circles) and in 10 mm Pi (green circles). B, relations between force (T, kPa) and shortening velocity during phase 4 in control (black circles) and in 10 mm Pi (green circles). Lines are Hill hyperbolic equations fitted to the data (same colour code as for data). Inset, same relations (experimental data omitted) with force expressed as T/T0. C, power–force relations calculated from data (symbols) and their fits (lines) in B. Inset, same relations with force expressed as T/T0. Data are means ± SEM.