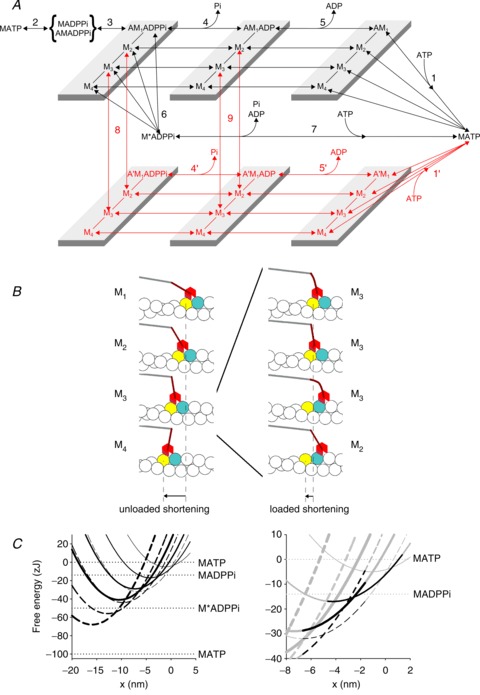
Figure 4. Chemo-mechanical cycle of the myosin motor and free energy diagrams of the four structural states of the actin-attached myosin motor in the AM.ADP.Pi state.

A, scheme representing the chemo-mechanical cycle assumed in the model simulation. The black transitions indicate the cycle undergone by myosin motors that interact with only one actin monomer (A). The red transitions indicate the cycle undergone by myosin motors that slip to the next actin monomer 5.5 nm away from the centre of the sarcomere (A′). M1–M4 represent the structural states for a given biochemical state of the attached myosin motor (AM.ADP.Pi, AM.ADP or AM). B, left panel: pictorial representation of the model showing the four structural states under unloaded conditions. B, right panel: representation of the slip of the M3 state from A to the next actin monomer (A′) during loaded shortening, followed by strain-dependent state re-equilibration. Colour code for the interacting actin monomers: A, yellow, A′, blue. Colour code for the myosin molecule: catalytic domain, red, lever arm, brown, S2 portion connected to the backbone, grey. C, left panel: free energy diagrams of the four structural states of the myosin motor in the AM.ADP.Pi state, attached to either the original actin monomer (A, continuous lines) or the next actin monomer farther from the centre of the sarcomere (A′, dashed lines). The thickness of the line identifies the progression of the state transitions, from M1, thinnest line, to M4, thickest line. The slip from A to A′ corresponds to a leftward 5.5 nm shift and a downward 27 zJ shift of the minimum of the free energy parabola of the motor in each state; the increase in strain of the motor implied in the A–A′ transition is shown by the difference in slope of the two free energy parabolas at the same x. x is zero in correspondence of the free energy minimum of a myosin motor attached to A in the M1 state. Horizontal lines show the free energy of the detached states. C, right panel: shown in grey are the same diagrams as in the left panel, but on an expanded scale to show the energy profiles in the x range concerning the slipping transition. Shown in black are the free energy profiles of the states populated during steady shortening at a velocity (<1000 nm s−1) that maximises the slipping process. The A-attached M2 motor (thinner continuous line) dwells between the transition to the M3 state (thicker continuous line) or the slipping to A′(dashed line with the same thickness); the increase in strain following the slipping favours the backward state transition to M1 (thinnest dashed line).
