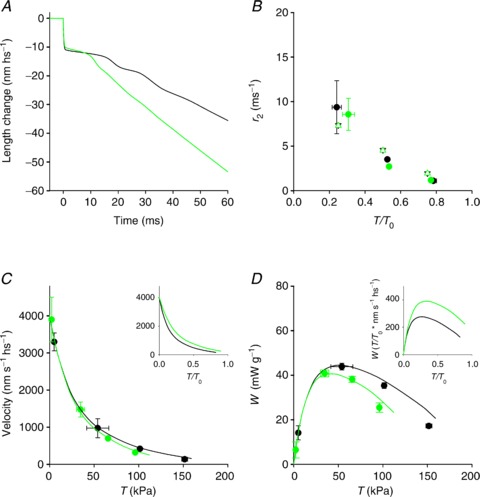
Figure 6. Comparison of the results of the simulation in control (black) and in the presence of 10 mm Pi (green).

A, simulated isotonic velocity transient following a step in force to 0.5 T0. B, dependence of r2 on T/T0 (filled circles, data from Fig. 2H; open triangles, simulation). C, force–velocity relations (circles, data from Fig. 3B; lines, simulation). D, power–force relation (circles, from Fig. 3C; lines, simulation). Inset in C and D simulated relations in relative units.
