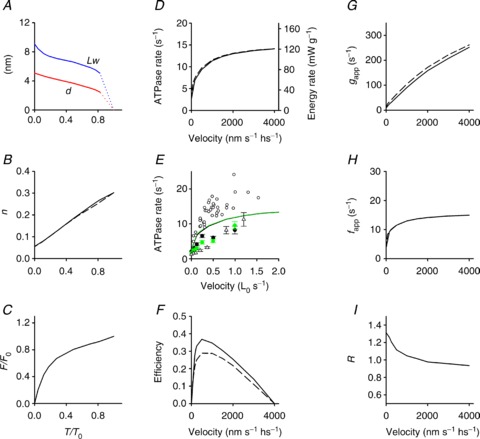
Figure 7. Simulation of mechanical and energetic parameters of the shortening muscle.

A, dependence on T/T0 of the average motor working stroke (d, red line) and of the average sliding distance during a motor working cycle (LW, blue line). B, fraction of attached motors versus T/T0. C, force per myosin motor relative to the isometric value (F/F0) versus T/T0. D, dependence on shortening velocity of the rate of ATP hydrolysis per myosin head (left ordinate, s−1) and of the rate of energy liberation calculated as detailed in the text (right ordinate, mW g−1). E, symbols: observed ATPase rate in control (black symbols) and in 10 mm Pi (green symbols) versus shortening velocity (open circles, He et al. 1999; filled circles, Potma & Stienen, 1996; open triangles, Sun et al. 2001). E, lines: model simulation in control (black) and in 10 mm Pi (green). F, efficiency versus shortening velocity. G and H, gapp and fapp versus shortening velocity. I, dependence on shortening velocity of the ratio (R) of the ATPase rate per myosin motor in 10 mm Pi over the control. Where present, the dashed lines are the simulations using the model that does not include the possibility of the motors slipping to the second actin.
