
Fig. 1.
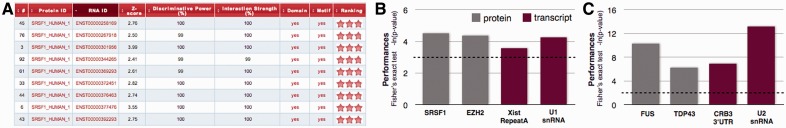
catRAPID omics features and performances. (A) Example of the output table showing Z-score (interaction propensity normalized with respect to experimental cases), discriminative power (with respect to training sets), interaction strength (enrichment with respect to random interactions) and presence of RNA binding domains as well as RNA motifs. Interaction scores are ranked according to a ‘star rating system’ ranging from 0 to 3 (http://service.tartaglialab.com/static_files/shared/faqs.html). A click on the text redirects to reference pages. Performances on (B) full-length proteins and (C) RNA binding protein domains. Gray is used to highlight transcriptomic studies (i.e. RNA sequencing) and red indicates proteomic analyses (i.e. mass spectrometry). The significance of our predictions was assessed using Fisher’s exact test (the dashed line corresponds to P = 0.05)