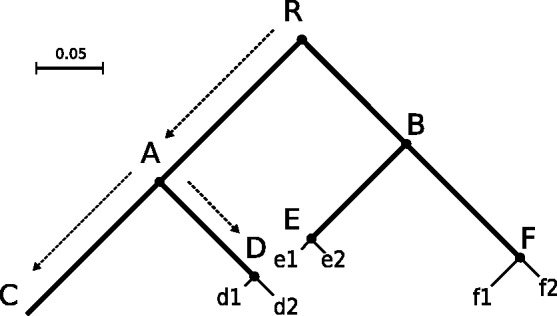
Fig. 1.

Illustration of the PTP. The example tree contains 6 speciation events: R, A, B, D, E, F, and 4 species: C, D, E, F. Species C consists of one individual; species D, E, F have two individuals each. The thick lines represent among-species PTP, and the thin lines represent within-species PTPs. The Newick representation of this tree is ((C:0.14, (d1:0.01, d2:0.02)D:0.1)A:0.15, ((e1:0.015, e2:0.014)E:0.1, (f1:0.03, f2:0.02)F:0.12)B:0.11)R. The tree has a total of 16 different possible species delimitations. The maximum likelihood search returned the depicted species delimitation with a log-likelihood score of 24.77, and  = 8.33 and
  = 55.05
