
Figure 4.
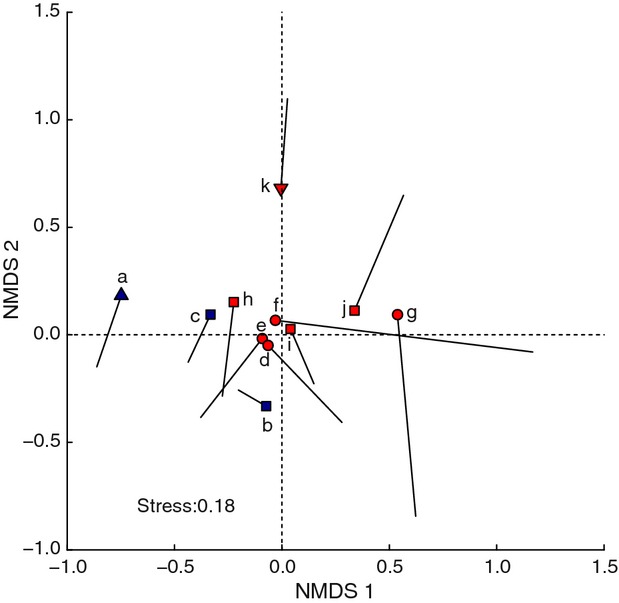
Non-metric dimensional scaling (NMDS) plot showing response of tree community over 20-year period for trees ≥3.7 cm DBH in 11 forest fragments in and around “Kampala area,” Uganda. Long line length indicates large changes and short line length shows minimal changes over the resample period. The labeled end points for the lines are 2010 positions. Forest names can be found in Table 1. For symbols, see Figure 2. * [Correction added on 17 September 2013, after first online publication: the labels on the points are added for this figure.]