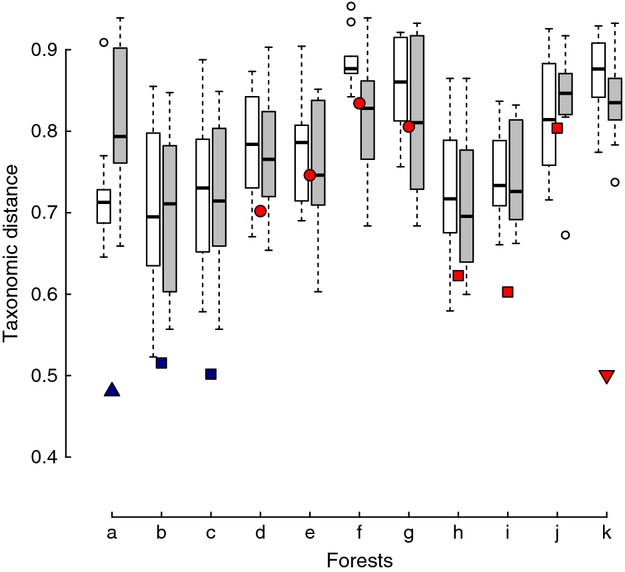
Figure 5.

Bray–Curtis dissimilarity measures for all stems combined (>3.7 cm DBH) for forest fragments in and around “Kampala area,” Uganda, in 1990 and 2010. The symbols represent the taxonomic turnover for each fragment; the box plots show the differences in the target fragment from all fragments in 1990 (white) and 2010 (grey). Forest names can be found in Table 1. For symbols, see Figure 2.
