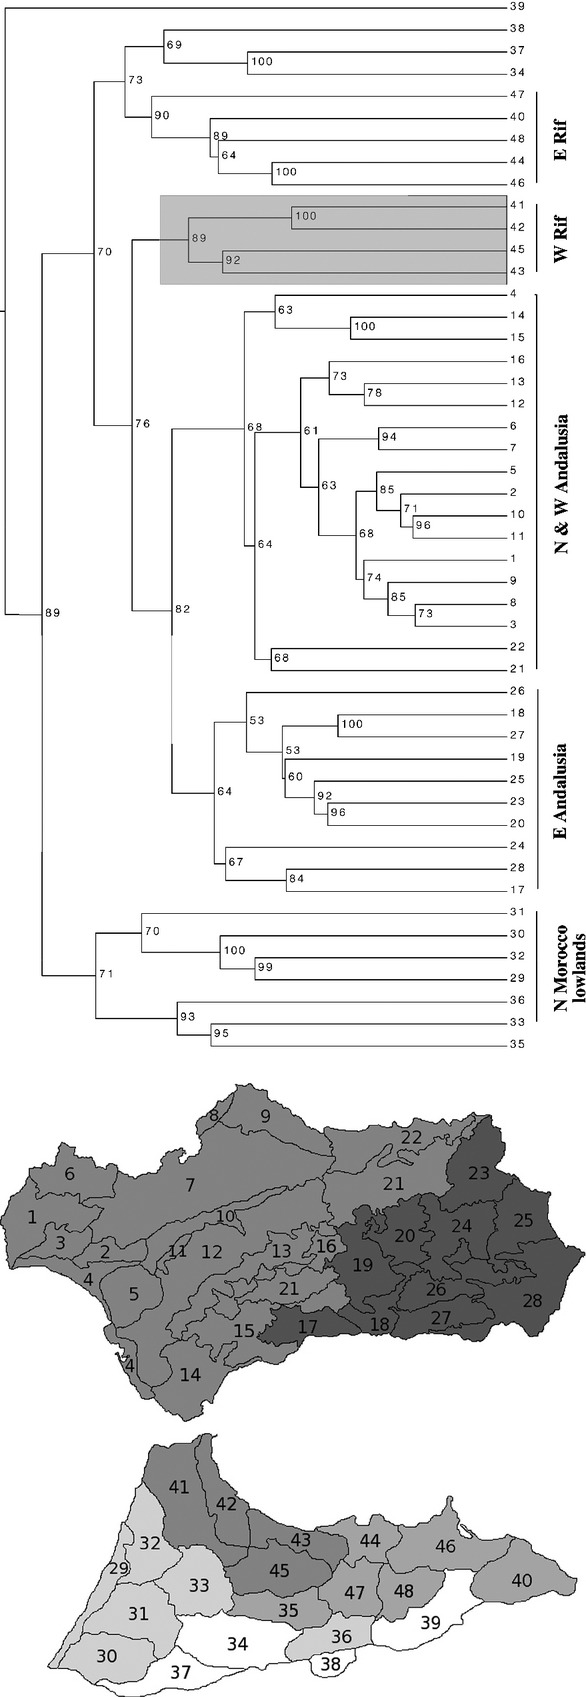
Figure 2.

Hierarchical cluster analysis (UPGMA) representation showing the floristic relationship between the ecoregions of Andalusia and northern Morocco. Node numbers are Approximate Unbiased P-values in percentage. The highlighted clade represents the West Rifan ecoregions, which are grouped together in Andalusian clusters. For ecoregions names see Appendix S1.
