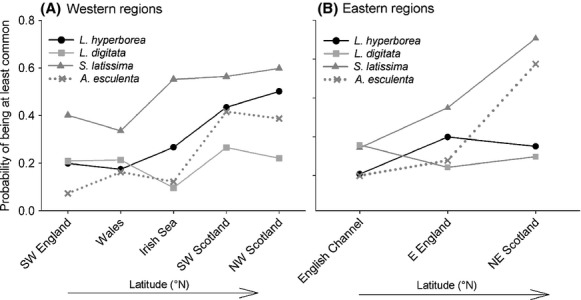
Figure 3.

Habitat-specific probability of occurrence for dominant kelp species in UK waters, for both western regions (A) and eastern regions (B), along a latitudinal gradient (∼49–59°N). Probabilities derived from subtidal habitat surveys conducted at 0–10 m depth (data from Marine Nature Conservation Review, 1977–2000, see Burrows 2012 for more methodological details and geographic limits of regions), which used ACFOR values (a semiquantitative abundance scale) to quantify benthic organisms. The number of independent surveys per region (i.e., n) ranged from 300 to 734.
