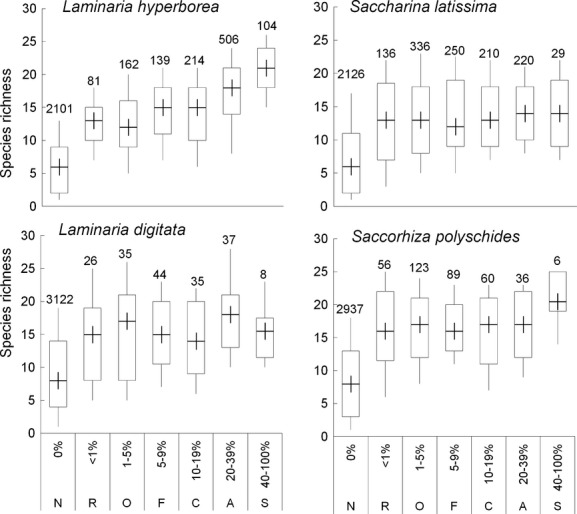
Figure 5.

Kelp species abundance and local species richness. Box plots show 10th, 25th, 50th, 75th, and 90th percentiles of species richness data for each modified SACFOR category of kelp species abundance. For each SACFOR category, n, which is the number of independent surveys conducted during the Marine Nature Conservation Review (1977–2000), is given.
