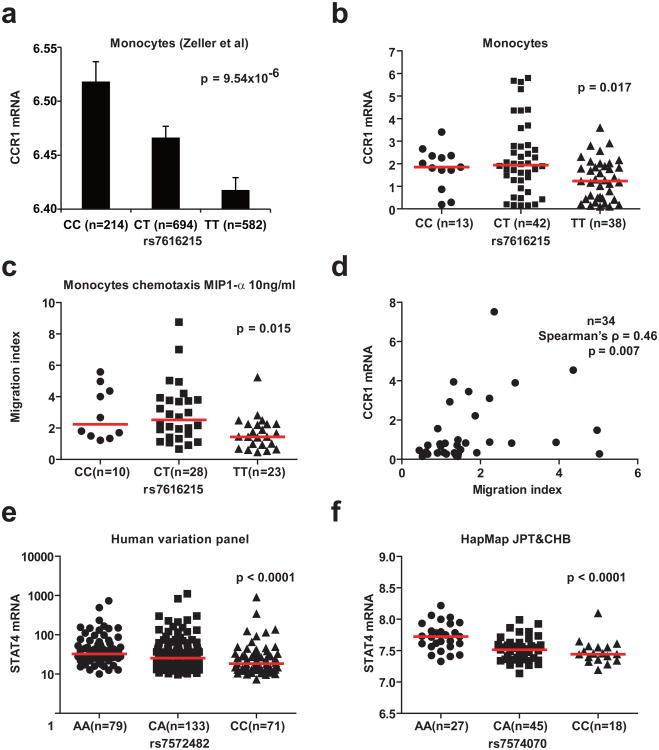
Figure 4. Association of CCR1 and STAT4 variants with gene expression levels and function in human cells.
(a) Mean CCR1 mRNA expression in human primary monocytes according to rs7616215 genotype (data from Zeller et al31). Error bars represent the standard error of the mean. (b) CCR1 mRNA expression in human primary monocytes from our study according to rs7616215 genotype. (c) Chemotaxis of human primary monocytes against a gradient of MIP1-α according to rs7616215 genotype. “Migration index” indicates number of migrated cells in the presence of MIP1-α divided by the number of migrated cells in the absence of MIP1-α from the same sample. (d) Correlation between monocyte CCR1 expression and chemotactic activity. Comparison between CCR1 mRNA level and chemotaxis migration index were determined in monocytes isolated from the same blood sample. Spearman correlation test was performed. (e) STAT4 mRNA expression in Human Variation Panel samples (GEO GSE24277). rs7572482 is a surrogate marker for rs7574070 (r2=1, D′=1 in HapMap CEU samples). (f) STAT4 mRNA expression in HapMap JPT and CHB samples according to rs7574070 genotype (GEO GSE6536). In panels b, c, e, and f, the horizontal bars indicate median values and the p-values shown are from the Kruskal-Wallis rank sum test.

