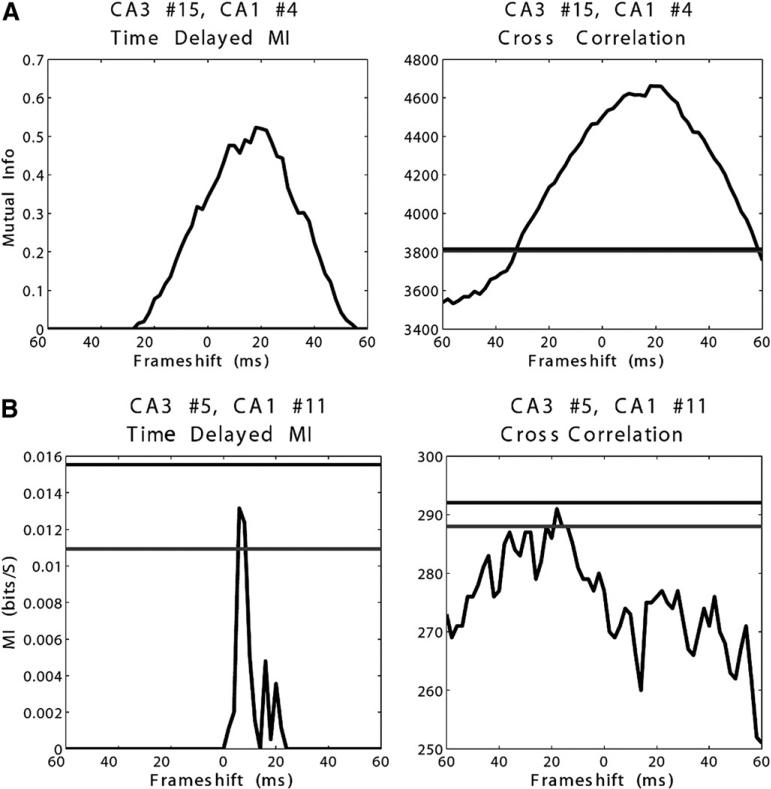
Figure 8.
(A) Example of time-delayed mutual information (MI) and cross-correlation in a CA3-CA1 pair reaching significance. Horizontal lines are 99% and 99.9% confidence intervals (nearly superimposed on this graph). (B) Example of time-delayed MI and cross-correlation in a CA3-CA1 pair with significance level between 99% and 99.9% confidence interval. Horizontal lines are 99% and 99.9% confidence intervals (nearly superimposed on this graph). Time-delayed MI appears to be maximal at a physiologically plausible time-lag, with cross-correlation more difficult to interpret.

