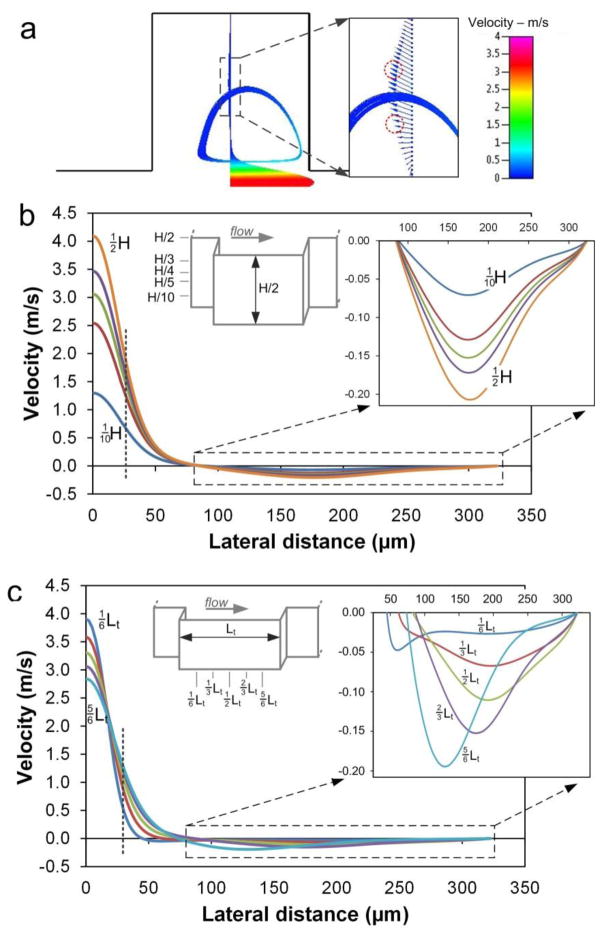
Fig. 2.
(a) Traces of streamlines indicating vortices within expansion area. Velocity profile through the chamber exhibits maximum at the vortex trajectory and the heterogeneous velocity direction. Red circles illustrate positions where particle orbits originate. The vortex is in the plane at quarter of channel height (¼H). (b) Velocity profiles (U-component, downstream direction) at different channel heights at ⅔Lt downstream from chamber entrance. Dashed line indicates the upstream channel width. (c) Velocity (U-component) as a function of lateral position at five downstream positions along the chamber length at ¼H. Dashed line indicates position of the upstream channel width. For all panels, Re = 154.

