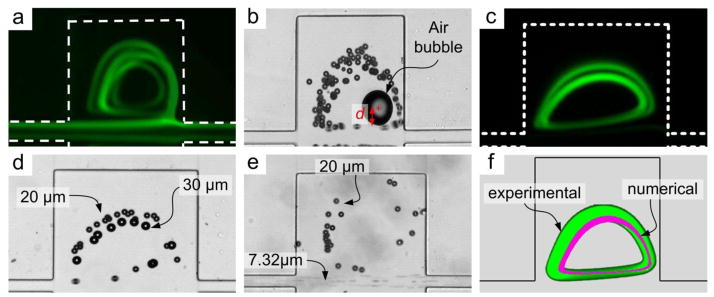
Fig. 4.

Visualization of particle vortices. (a) Fluorescent traces of the 3D particle vortices at Re=135. Here the straight channel prior to expansions was 1 mm long. (b) Particle recirculation around center of the vortex indicated by a stationary air bubble. d indicates distance between particles entering trapping chamber and the vortex center. (c) Fluorescent trajectories of two particle vortices. (d) Brightfield image illustrating smaller 20 μm diameter particles occupying the larger outer orbit, while the 30 μm diameter particles occupy the tighter inner orbit. (e) Size-selective trapping of 20 μm diameter particles from a mixture with 7.32 μm particles which pass though the device. The concentration ratio (large vs. small particles) was 1:105. (f) Composite image of experimental (green) and numerical (purple) results at Re = 80. The green vortex is the fluorescent trace of 20 μm diameter particles in a 300 μm × 300 μm chamber.
