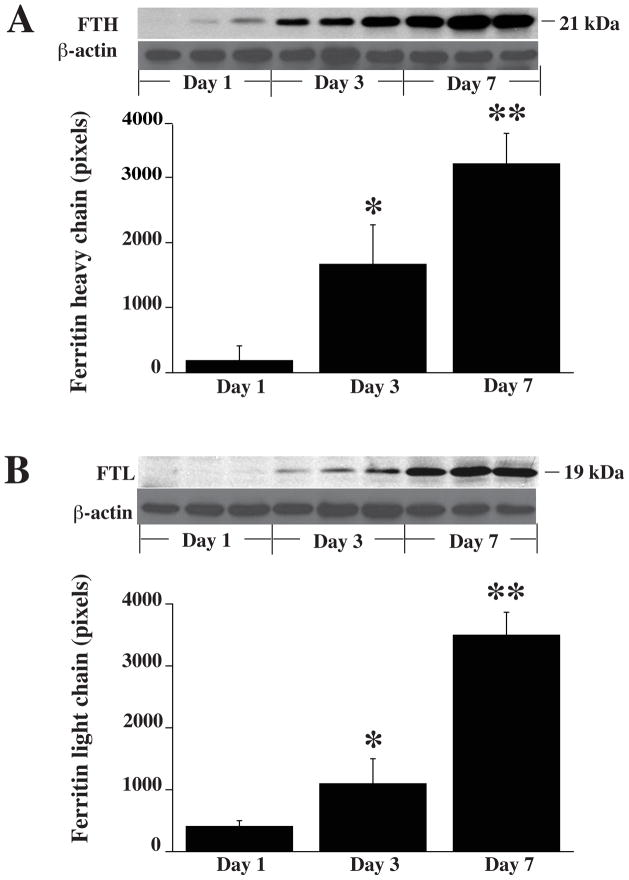
Figure 5.
A) Western blot analysis showing the time course of ferritin heavy-chain (FTH) levels in the ipsilateral basal ganglia 1, 3 and 7 days after ICH in vehicle-treated group. Bar graph quantifies the Western blotting. Beta-actin is a loading control. B) Western blot analysis showing the time course of the levels of ferritin light-chain (FTL) levels in the ipsilateral basal ganglia 1, 3 and 7 days after ICH in vehicle-treated group. Bar graph quantifies the Western blotting. Values are mean±SD, n=3 rats per group, *P<0.05 vs. ICH+vehicle group, **P<0.01 vs. ICH+vehicle group.

