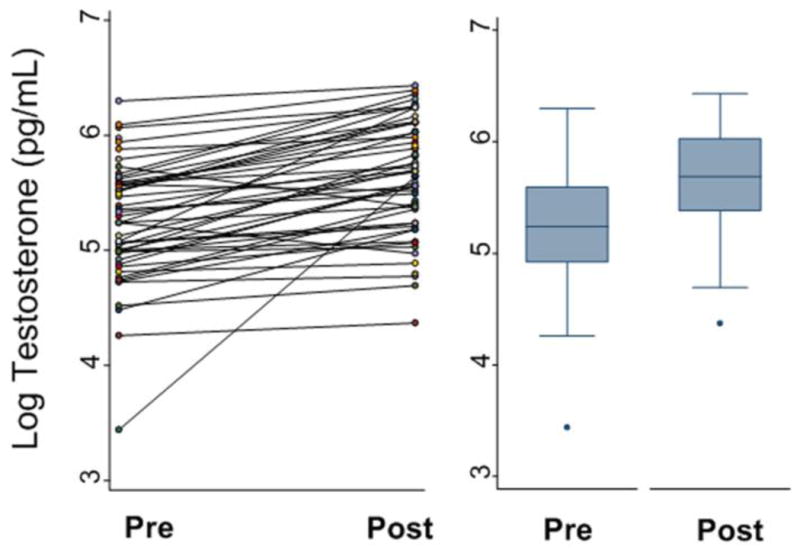
Figure 2. Salivary testosterone before and after one hour of tree-chopping.

Figure 2A represents the individual changes (n=49) in log testosterone before and after intense physical activity. Figure 2B is the predicted change in testosterone controlling for BMI, and time of day.
