
Figure 3. Individual change in testosterone by age for (A) tree chopping and (B) resting.
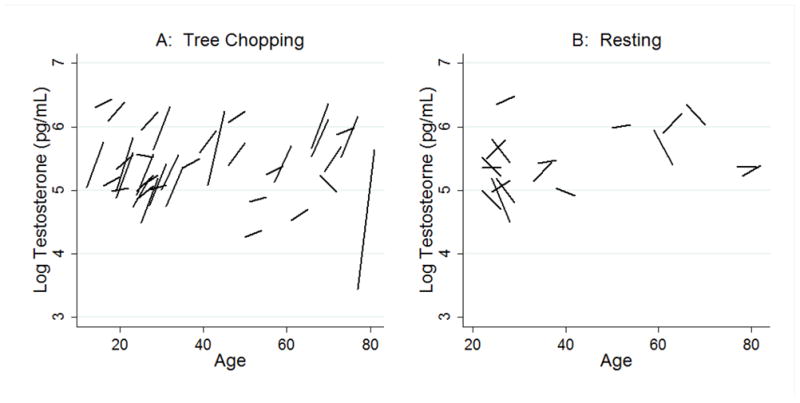
Each line segment represents the individual change in testosterone from before to after one hour of (A) tree chopping (n=49) or (B) resting (n=20) centered on the age of the individual. The left end-point of each line is the testosterone before, and the right end-point represents the individual testosterone after one hour of (A) tree chopping, or (B) resting.