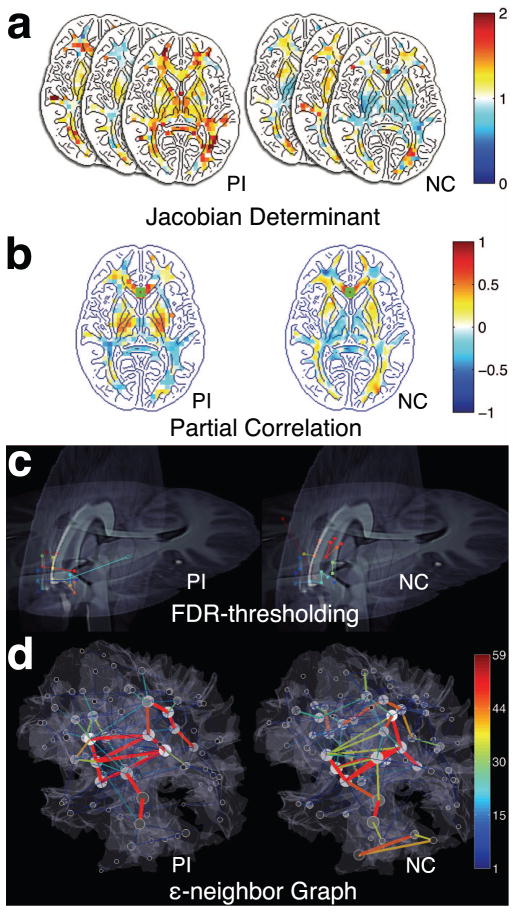
Fig. 1.
Framework of the proposed analysis applied to post-institutionalized (PI) children and normal control (NC). (a) Jacobian determinant maps of individuals projected on the template. (b) partial correlation maps seeded at the genu (marked with green squares) (c) FDR-thresholding on partial correlation is used to establish edges of the connectivity network. Only edges connecting near the genu are visualized. The different pairings are marked with different colors. (d) The proposed ε-neighbor graphs of connectivity. Only positive correlations are shown here. The gray shading of nodes indicates the node degree. The size of nodes represents the number of nodes that are merged in the ε-neighbor construction.

