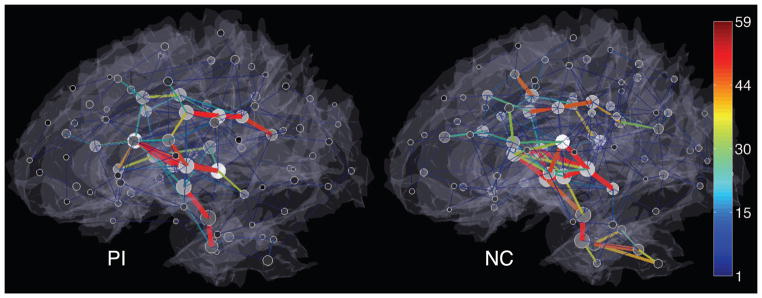
Fig. 4.

Local connectivity patterns of the ε-neighbor graphs. Only positive correlations are shown in a lateral view. Edges are color-coded by the number of merged connections implying the strength of connections. The gray shading of nodes indicates the degree and the size of nodes represents the number of nodes that are merged.
