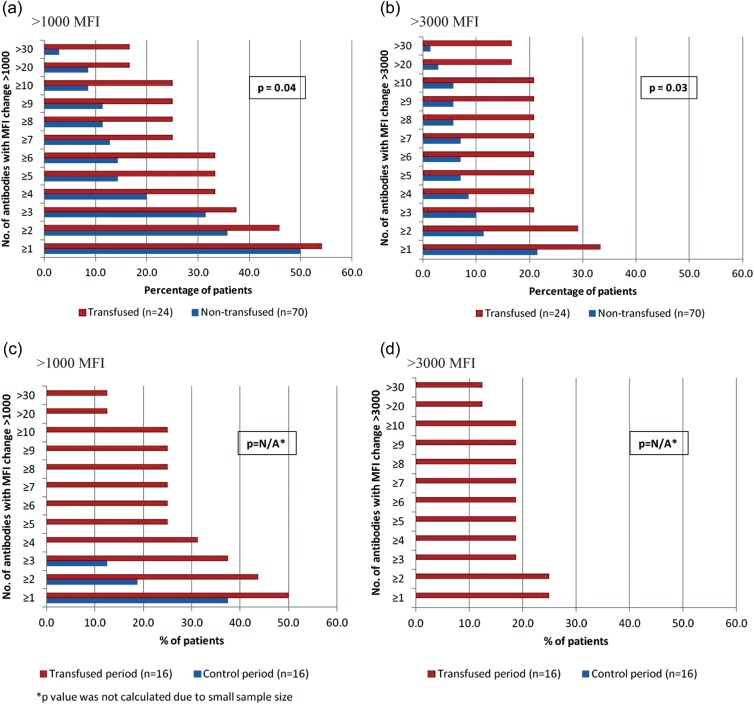
FIGURE 4:
Change in MFI for each unique HLA antibody identified in all patients included in transfused and matched nontransfused groups (a and b) and crossover cohorts (c and d) excluding patients with proinflammatory events. The P-values presented in a and b are based on Pearson χ2 analyses comparing the proportion of patients in the transfused and nontransfused groups with >10 (versus <10) HLA antibodies increasing >1000 MFI (a) and >3000 MFI (b). The P-values presented in c and d are based on Sign tests comparing the number of HLA antibodies increasing >1000 MFI (c) and >3000 MFI (d) during the transfused and control periods.

