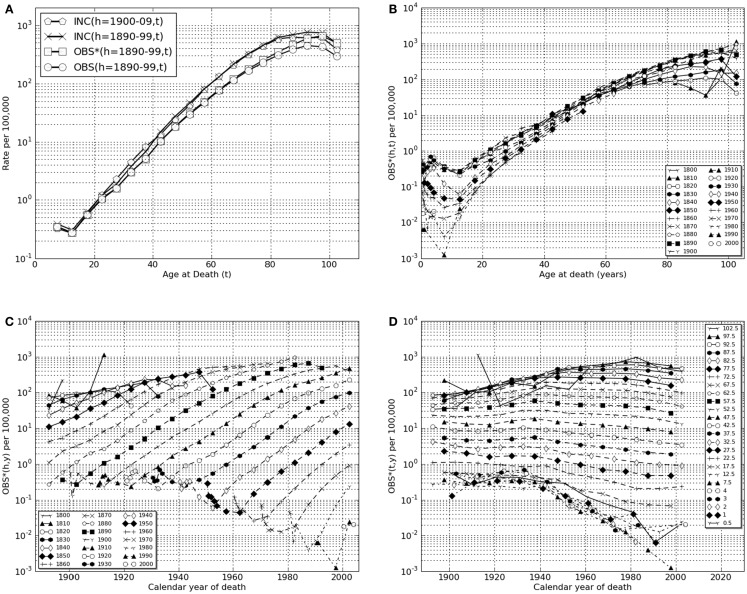
Figure 1.
Lower gastrointestinal cancer in European-American males, calendar years of death, 1890–2006. (A) Transformations linking raw mortality rates, OBS(h,t), with estimates of incidence rates, INC(h,t). Shown are the raw mortality rate function, OBS(h,t), for h = 1890–99 corrected for coincident forms of death which becomes the function OBS*(h,t) which, in turn, corrected for historically increasing survival rate, becomes the incidence rate function, INC(h,t). Also shown is INC(h = 1900–09, t). (B) OBS*(h,t), coincidence corrected death rates for birth cohort intervals, h = 1800–09, …, 2000–06, vs. age intervals of death, “t” = 0.5, 1, 2, 3, 4, 5–9, …, 100–104. (C) OBS*(h,y), coincidence corrected death rates for birth-decade intervals, h vs. calendar year of death intervals, “y” = 1900–1904, …, 2000–2004, 2005–2006. (D) OBS*(t,y), coincidence corrected death rates for intervals of age at death “t” vs. calendar year of death intervals, “y.”

