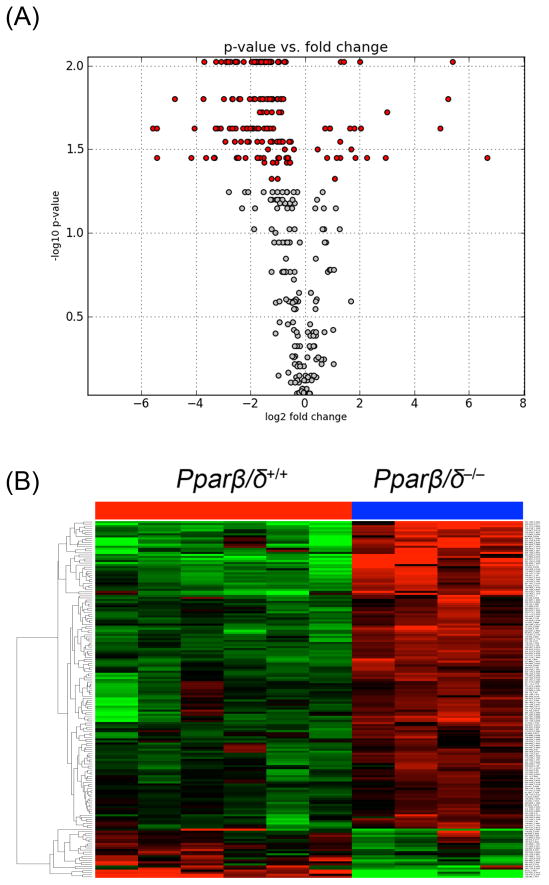
Fig. 4.
Differential presence of urinary ions between control Pparβ/δ+/+ and Pparβ/δ−/− mice after four months of feeding. (A) Volcano plot (ESI–) and (B) heatmap (ESI–) showing up- and down-regulation of several ions in Pparβ/δ−/− mice compared to Pparβ/δ+/+ mice fed the control liquid diet. The volcano plot depicts the statistically significant ions in red and the non-statistically significant ions are shown in grey.

