. 2013 Sep;15(3):263–278. doi: 10.31887/DCNS.2013.15.3/goz

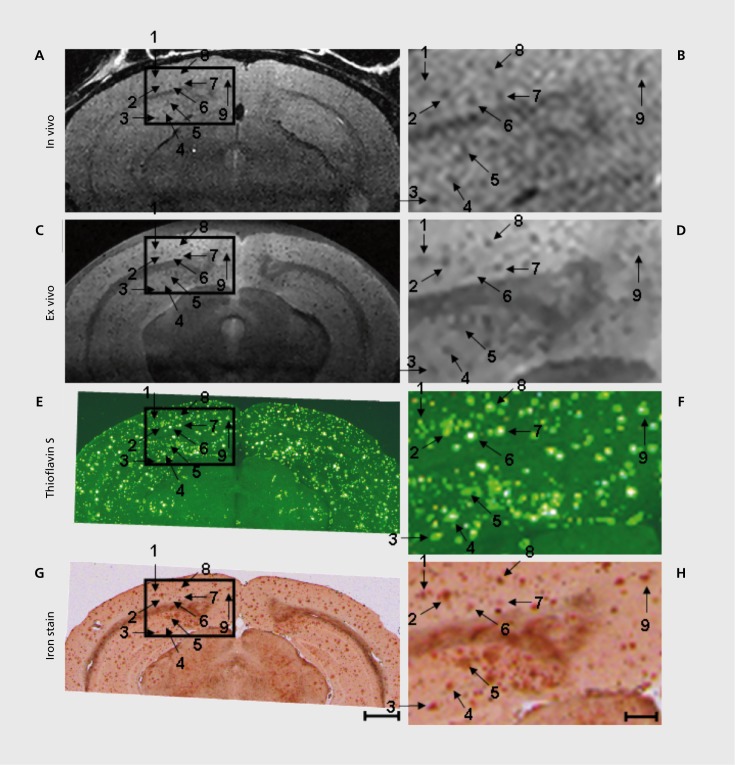
Figure 3. 9.4 T MRI and histology of 24 6-month 6-old AD mouse. In vivo MRI (A, B), ex vivo MRI (C, D), Thio-S (E, F), and iron stained images (G, H) have been precisely spatially registered over a circumscribed area of the cortex, indicated by the box. The boxes in the right column (scale bar = 100 µm) represent 3X magnified portions of the adjacent parent image in the left column (scale bar= 1.0 mm). Numbered arrows indicate individual plaques visualized in each of the four different image types. Adapted from ref 79: Jack CR, Jr, Wengenack TM, Reyes DA, et al. In vivo magnetic resonance microimaging of individual amyloid plaques in Alzheimer's transgenic mice. J Neurosci. 2005;25:10041-10048. Copyright © Society for Neuroscience 2005.

Figure 3.