. 2013 Sep;15(3):359–384. doi: 10.31887/DCNS.2013.15.3/edennis

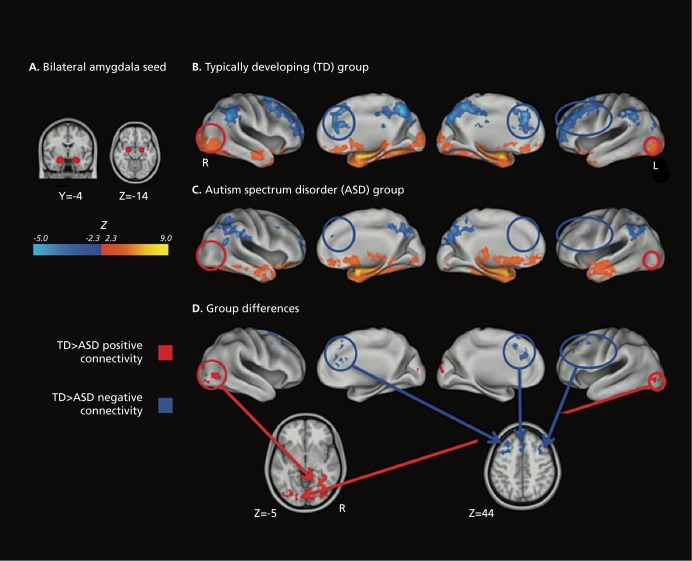
Figure 6. Functional connectivity in autism. Bilateral amygdala connectivity. (A) The Harvard-Oxford bilateral amygdala (25% probability) used as seed region and displayed on the 1 mm MNI152 T1 standard brain. (B) Typically developing (TD) within-group connectivity maps, (C) Autism spectrum disorder within-group connectivity maps, and (D) direct between-group contrasts rendered on the Inflated PALS B12 brain using CARET (Computerized Anatomical Reconstruction and Editing Toolkit) and on the 1 mm Montreal Neurological Institute (MNI)152 T1 standard brain using Analysis of Functional Neurolmages. Maps are thresholded at Z > 2.3 (P< 0.01) with correction for multiple comparisons applied at the cluster level (P< 0.05). Red circles highlight areas of greater positive connectivity with the seed region for the TD group. Blue circles highlight areas of greater negative connectivity with the seed region for the TD group. The original paper also details the connectivity of the right inferior frontal gyrus, pars opercularis. Adapted from ref 91: Rudie JD, Shehzad Z, Hernandez LM, et al. Reduced functional integration and segregation of distributed neural systems underlying social and emotional information processing in autism spectrum disorders. Cereb Cortex. 2012;22:1025-1037. Copyright © Oxford University Press 2012.

Figure 6.