. 2013 Sep;15(3):359–384. doi: 10.31887/DCNS.2013.15.3/edennis

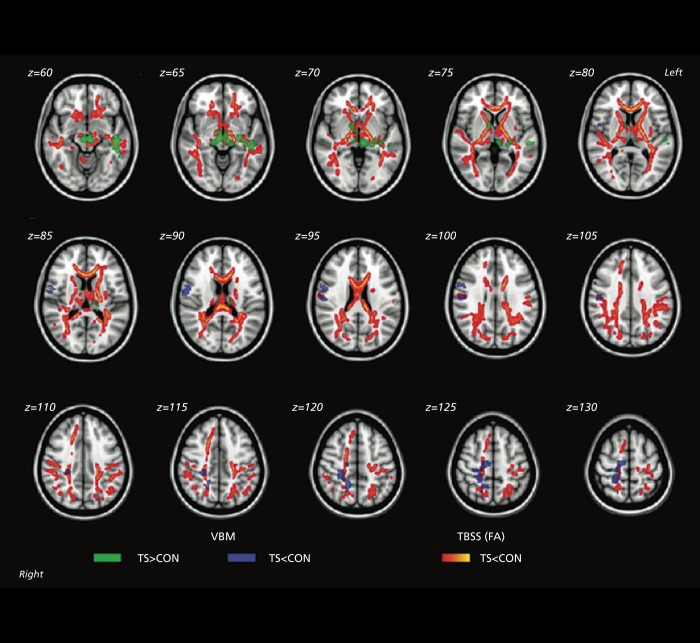
Supplementary Figure 4. Differences in white matter and gray matter in Turner syndrome (TS). Superimposed results of voxels showing significant fractional anisotropy (FA) reduction in the tract-based spatial statistics (TBSS) and voxel-based morphometry (VBM) clusters showing significant white matter volume (WMV) differences between the groups (P< 0.05, familywise error rate corrected). Group differences in TBSS were “thickened” (for visualization purposes) by expanding the significant white matter skeleton cluster to the full extent of the local FA map. 1) FA reduction in TS relative to controls (CON) is shown in red-yellow. 2) Greater WMV in TS relative to CON is shown in green. 3) Reduced WMV in TS relative to CON is shown in blue. Results are mapped onto a standard T1 -weighted Montreal Neurological Institute 152 template. Reproduced from ref 160: Yamagata B, Barnea-Goraly N, Marzelli MJ, et al. White matter aberrations in prepubertal estrogen-naive girls with monosomic Turner syndrome. Cereb Cortex. 2012;22:2761-2768. Copyright © Oxford University Press 2012.

Supplementary Figure 4.