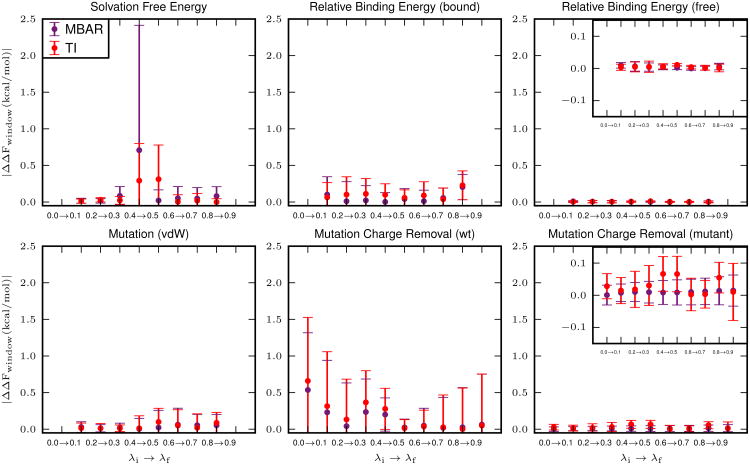
Figure 4.
The deviation in the free energy, separated into contributions from each pair of adjacent λ values (windows). The free energy for each window describes the free energy change for the non-physical transformation from λi to λf. Each point represents the deviation in this value calculated from pmemd and sander, averaged over five independent calculations. Error bars represent the propagation of the standard deviation of the free energies calculated from independent simulations (eq. 12). The production stage for each window was simulated for 5 ns.

