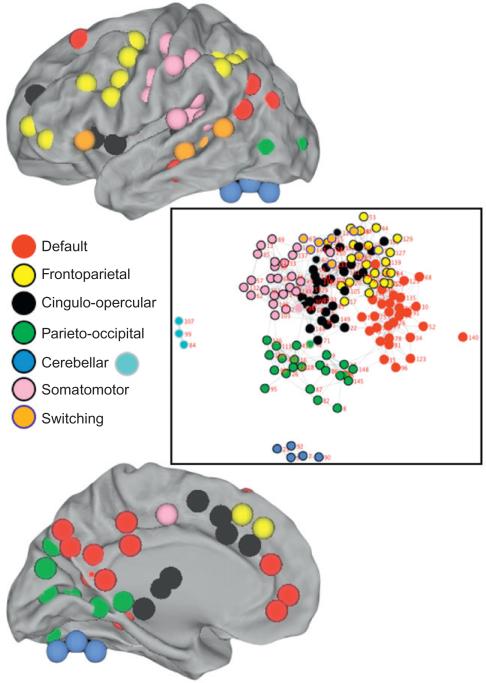
Fig. 4.
Community structure in the wake state global network architecture. CARET maps show the communities to which each of 151 regions of interest were assigned. Notably, regions segregate into communities whose anatomical locations are consistent with a set of neural networks (legend) defined both on task and resting state fMRI. The central map illustrates community structure using the SoNIA visualization tool based on modularity analysis of global network structure. Subnetwork connectedness and the degree to which each community segregates from others in the network can be seen using this tool.

