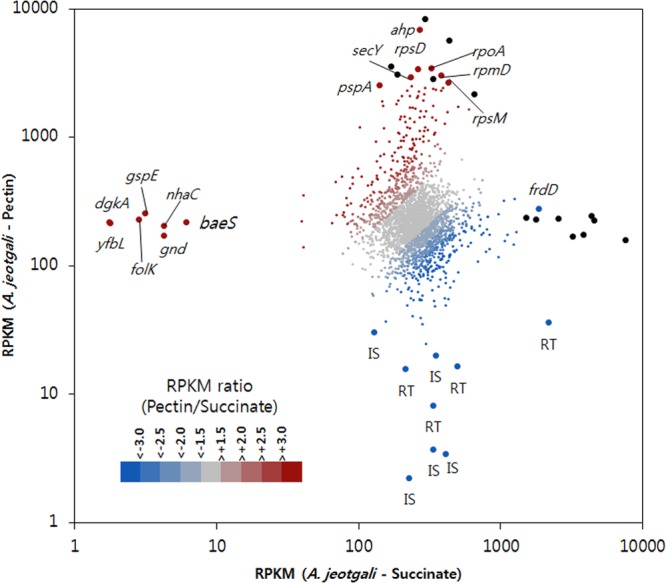
Fig 3.

xy plot of RPKM values from A. jeotgali cells grown on pectin and succinate. A dot indicates a gene, and its x and y coordinates are the RPKM from succinate- and pectin-grown A. jeotgali cells. Fold changes (RPKM ratio of pectin/succinate) are represented with a color gradient. Gene symbols are marked next to the selected dot. Black dots indicate hypothetical proteins or proteins annotated with only general function. IS, transposase; RT, reverse transcriptase.
