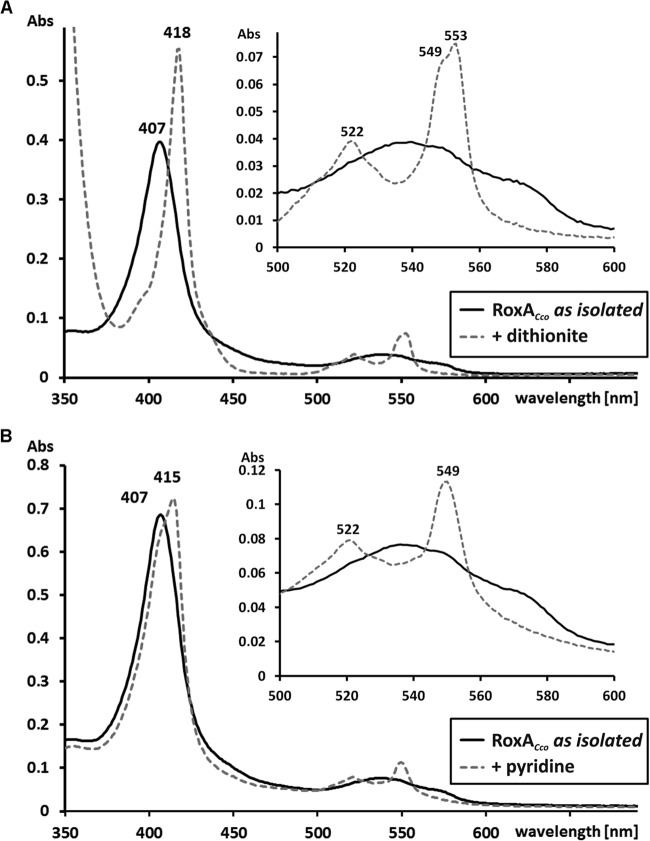
Fig 4.
UV-vis spectra of purified RoxACco. (A) UV-vis spectra of RoxACco as isolated (solid line) and of dithionite-reduced RoxACco (dashed line); (B) UV-vis spectrum of RoxACco as isolated (solid line) compared with the spectrum obtained after incubation of RoxA with 2 mM pyridine. The Soret band region is enlarged in the insets in both panels, and the absorption maxima of RoxA are indicated. Note that the presence of pyridine resulted in an increase of only the 549-nm α band, while in chemically reduced RoxACco, both α bands (549 to 553 nm) are visible. Abs, absorbance.

