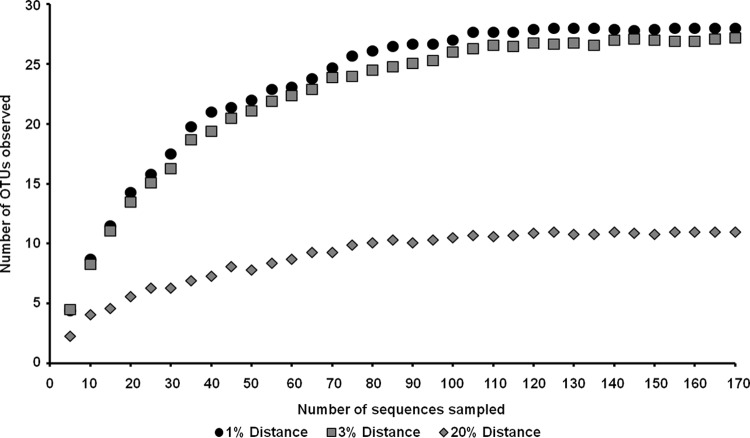
Fig 4.
Rarefaction curves indicating the observed numbers of OTUs within the 16S rRNA gene libraries derived from the PBR biofilm at T5 after filtering of the chloroplast sequences. The curves were calculated with QIIME (65). OTUs are shown at 1, 3, and 20% genetic-distance levels.

