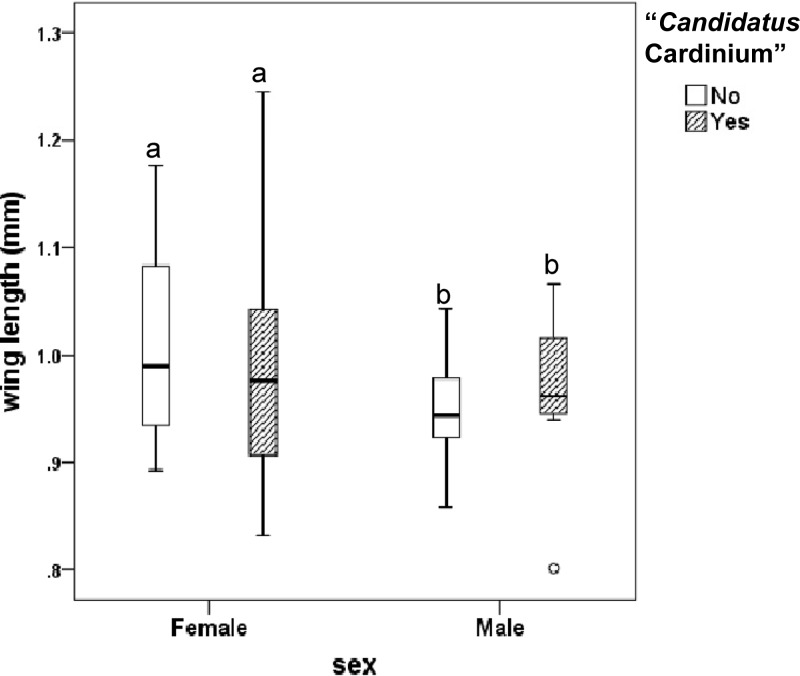
Fig 2.
Box plots presenting wing lengths of field-collected C. imicola males (n = 30) and females (n = 70) with different “Candidatus Cardinium” infection status. The bottom and top of the boxes are first and third quartiles, respectively. The whiskers represent minimum and maximum length. The median line is shown in each box plot. Different letters above the box plots indicate significant differences (t test for equality of means; Levene's test for equal variances).

