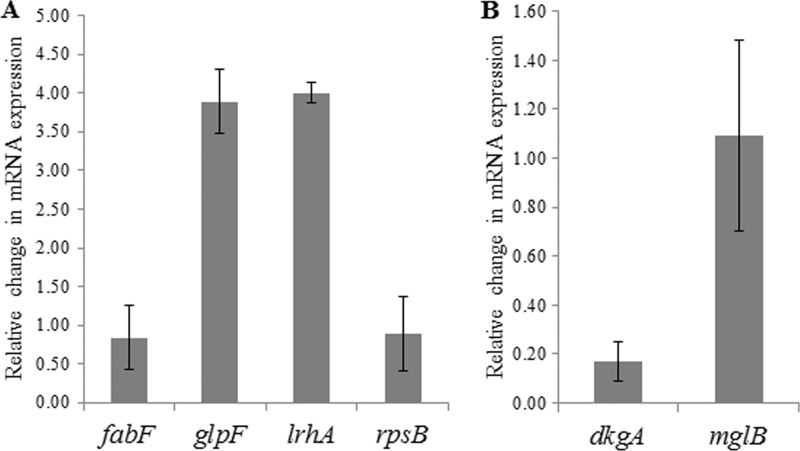
Fig 2.
Relative change in mRNA expression in P. stewartii ESΔIR(pSVB60) versus ESΔIR(pBBR1MCS-3). Genes activated (A) or repressed (B) by EsaR. Error bars were calculated from triplicate samples obtained from two replicate experiments. All values are normalized with respect to the change in mRNA expression of 16S rRNA which was set at 1.

