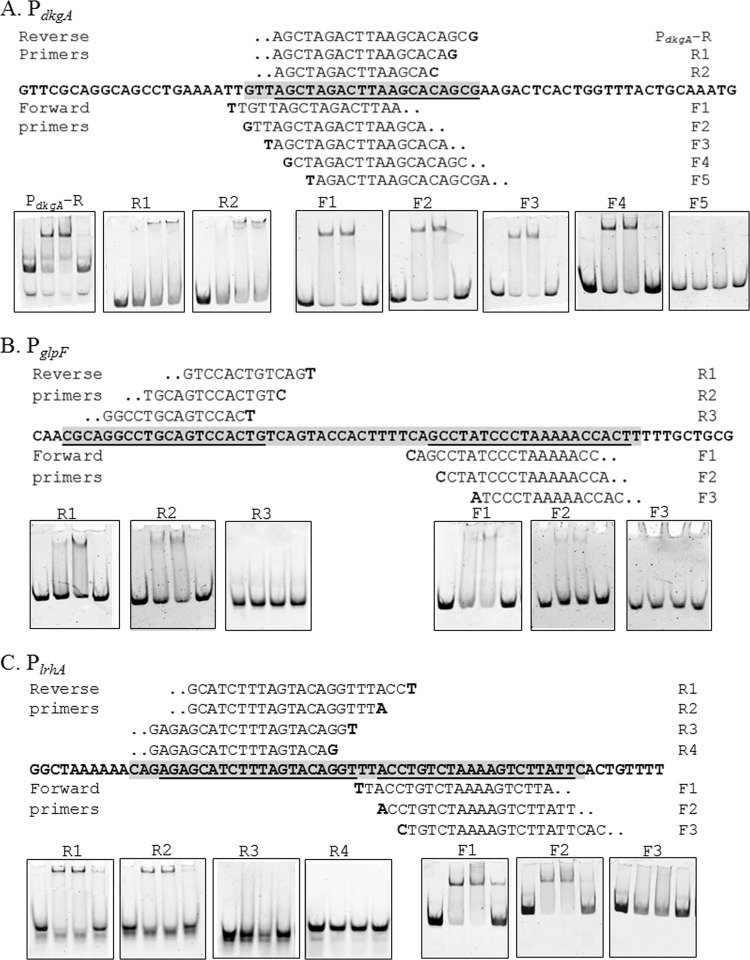
Fig 4.
Nested deletion EMSA analysis of EsaR direct targets. (A to C) The region protected by DNase I digestion in PdkgA (A), PglpF (B), and PlrhA (C) is the gray-shaded sequence (5′ to 3′), and the underlined bases are the 20-bp EsaR binding sites. Sequences above and below the bold sequence are forward and reverse primers used to identify the required bases, and the bold letters in the primer sequence indicate the 5′ start base for the primer. EMSAs in boxes denote the point where binding by EsaR is lost upon removing flanking bases of the EsaR binding site. The concentration of DNA probe in all lanes is 10 nM. Lanes within each panel consist of the following (from left to right): DNA probe, DNA probe with 50 nM HMGE, DNA probe with 100 nM HMGE, and DNA probe with 100 nM HMGE plus 100 nM unlabeled DNA probe.

