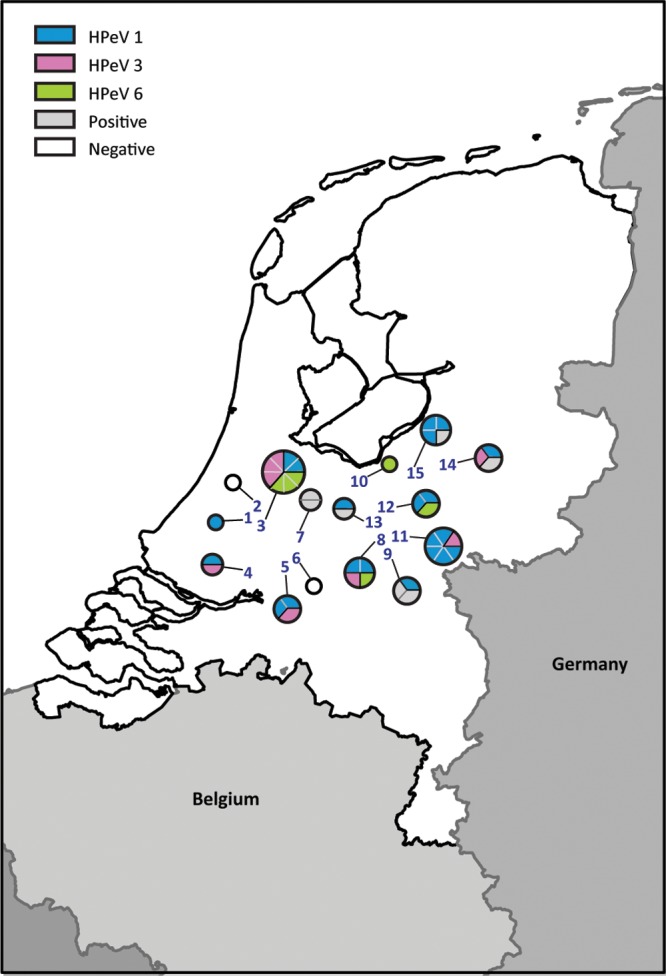
Fig 1.

Sample locations (numbers) correspond to the numbers in Table 1. Each circle represents the types of HPeV found (color) at each location. The number of pie parts of one color represents the number of samples in which this HPeV type was detected over time.
